- 您現(xiàn)在的位置:買賣IC網(wǎng) > PDF目錄359354 > VDP3130Y (MICRONAS SEMICONDUCTOR HOLDING AG) Video Processor Family PDF資料下載
參數(shù)資料
| 型號(hào): | VDP3130Y |
| 廠商: | MICRONAS SEMICONDUCTOR HOLDING AG |
| 英文描述: | Video Processor Family |
| 中文描述: | 視頻處理器系列 |
| 文件頁(yè)數(shù): | 21/76頁(yè) |
| 文件大?。?/td> | 1770K |
| 代理商: | VDP3130Y |
第1頁(yè)第2頁(yè)第3頁(yè)第4頁(yè)第5頁(yè)第6頁(yè)第7頁(yè)第8頁(yè)第9頁(yè)第10頁(yè)第11頁(yè)第12頁(yè)第13頁(yè)第14頁(yè)第15頁(yè)第16頁(yè)第17頁(yè)第18頁(yè)第19頁(yè)第20頁(yè)當(dāng)前第21頁(yè)第22頁(yè)第23頁(yè)第24頁(yè)第25頁(yè)第26頁(yè)第27頁(yè)第28頁(yè)第29頁(yè)第30頁(yè)第31頁(yè)第32頁(yè)第33頁(yè)第34頁(yè)第35頁(yè)第36頁(yè)第37頁(yè)第38頁(yè)第39頁(yè)第40頁(yè)第41頁(yè)第42頁(yè)第43頁(yè)第44頁(yè)第45頁(yè)第46頁(yè)第47頁(yè)第48頁(yè)第49頁(yè)第50頁(yè)第51頁(yè)第52頁(yè)第53頁(yè)第54頁(yè)第55頁(yè)第56頁(yè)第57頁(yè)第58頁(yè)第59頁(yè)第60頁(yè)第61頁(yè)第62頁(yè)第63頁(yè)第64頁(yè)第65頁(yè)第66頁(yè)第67頁(yè)第68頁(yè)第69頁(yè)第70頁(yè)第71頁(yè)第72頁(yè)第73頁(yè)第74頁(yè)第75頁(yè)第76頁(yè)
ADVANCE INFORMATION
VDP 313xY
Micronas
21
2.11.Video Back End
The digital RGB signals are converted to analog RGBs
using three video digital to analog converters (DAC)
with 10-bit resolution. An analog brightness value is
provided by three additional DACs. The adjustment
range is 40 % of the full RGB range.
Controlling the whitedrive/analog brightness and also
the external contrast and brightness adjustments is
done via the Fast Processor, located in the front-end.
Control of the cutoff DACs is via I
2
C-bus registers.
Finally cutoff and blanking values are added to the
RGB signals. Cutoff (dark current) is provided by three
9-bit DACs. The adjustment range is 60 % of full scale
RGB range.
The analog RGB-outputs are current outputs with cur-
rent-sink characteristics. The maximum current drawn
by the output stage is obtained with peak white RGB.
An external half contrast signal can be used to reduce
the output current of the RGB outputs to 50 %.
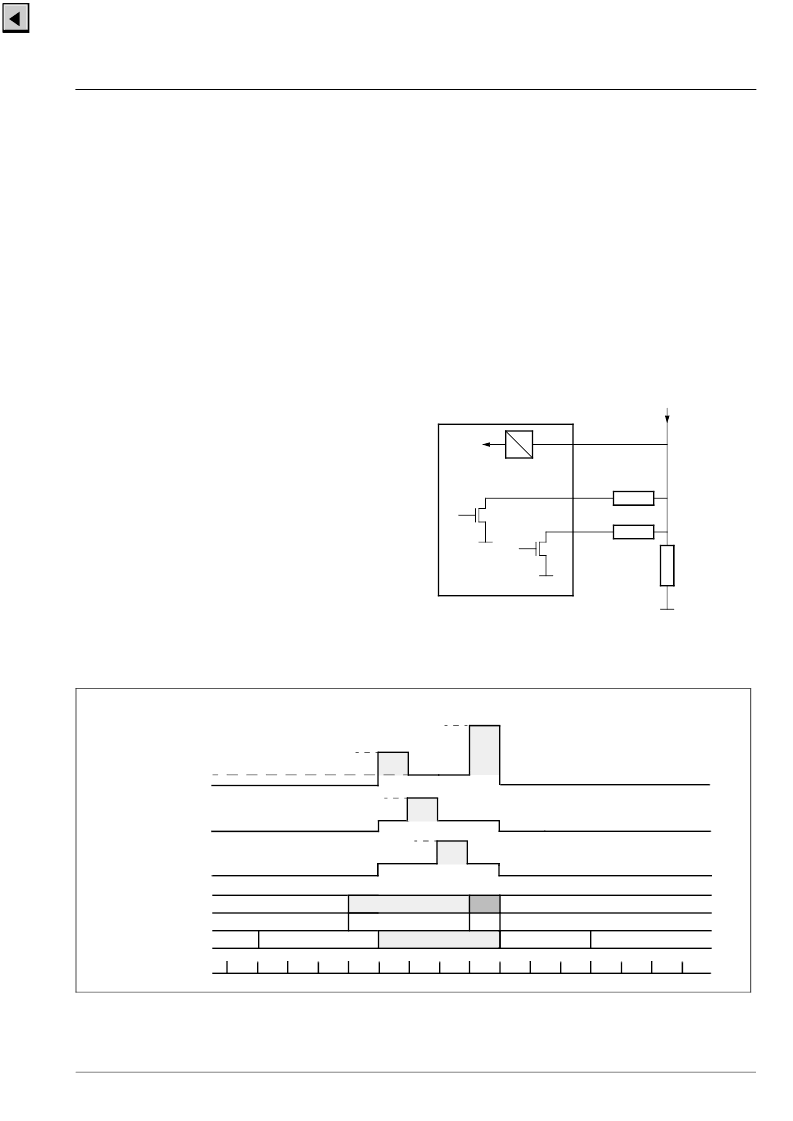
2.11.1.CRT Measurement and Control
The display processor is equipped with an 8-bit
PDM-ADC for all measuring purposes. The ADC is
connected to the sense input pin, the input range is 0
to 1.5 V. The bandwidth of the PDM filter can be
selected; it is 40/80 kHz for small/large bandwidth set-
ting. The input impedance is more than 1 M
.
Cutoff and whitedrive current measurement are carried
out during the vertical blanking interval. They always
use the small bandwidth setting. The current range for
the cutoff measurement is set by connecting a sense
resistor to the MADC input. For the whitedrive mea-
surement, the range is set by using another sense
resistor and the range select switch 2 output pin
(RSW2). During the active picture, the minimum and
maximum beam current is measured. The measure-
ment range can be set by using the range select switch
1 pin (RSW1) as shown in Fig. 2
–
1 and Fig. 2
–
18. The
timing window of this measurement is programmable.
The intention is to automatically detect letterbox trans-
mission or to measure the actual beam current. All
control loops are closed via the external control micro-
processor.
Fig. 2
–
1:
MADC Range Switches
Fig. 2
–
18:
MADC Measurement Timing
A
D
MADC
beam current
SENSE
RSW1
RSW2
R3
R2
R1
Lines
R1||R2||R3
RSW1=on, RSW2=on
PICTURE MEAS.
PMSO
R1
CB + IBRM
B
cutoff
CR + IBRM + WDRV
WDR
CR + IBRM
CG + IBRM
G
cutoff
R1||R3
=on
R1||R2||R3
RSW1=on, RSW2=on
PICTURE MEAS.
PMST
TML
TUBE MEASUREMENT
R
G
B
white
drive
R
black
ultra black
active measure-
ment resistor
cutoff
R
相關(guān)PDF資料 |
PDF描述 |
|---|---|
| VDP31XXB | Video Processor Family |
| VDP3108PR | Consumer IC |
| VDSGLD_38.88 | TRANS PREBIASED PNP 200MW SOT23 |
| VDSL5100I | TVS 400W 43V UNIDIRECT SMA |
| VDSL5100 | TVS 400W 40V BIDIRECT SMA |
相關(guān)代理商/技術(shù)參數(shù) |
參數(shù)描述 |
|---|---|
| VDP3131Y | 制造商:MICRONAS 制造商全稱:MICRONAS 功能描述:Video Processor Family |
| VDP3132Y | 制造商:MICRONAS 制造商全稱:MICRONAS 功能描述:Video Processor Family |
| VDP3133Y | 制造商:MICRONAS 制造商全稱:MICRONAS 功能描述:Video Processor Family |
| VDP3134Y | 制造商:MICRONAS 制造商全稱:MICRONAS 功能描述:Video Processor Family |
| VDP313XY | 制造商:MICRONAS 制造商全稱:MICRONAS 功能描述:Video Processor Family |
發(fā)布緊急采購(gòu),3分鐘左右您將得到回復(fù)。