- 您現(xiàn)在的位置:買賣IC網(wǎng) > PDF目錄372108 > SAA2502 (NXP Semiconductors N.V.) ISO/MPEG Audio Source Decoder PDF資料下載
參數(shù)資料
| 型號: | SAA2502 |
| 廠商: | NXP Semiconductors N.V. |
| 英文描述: | ISO/MPEG Audio Source Decoder |
| 中文描述: | 的ISO / MPEG音頻信源解碼器 |
| 文件頁數(shù): | 22/64頁 |
| 文件大?。?/td> | 318K |
| 代理商: | SAA2502 |
第1頁第2頁第3頁第4頁第5頁第6頁第7頁第8頁第9頁第10頁第11頁第12頁第13頁第14頁第15頁第16頁第17頁第18頁第19頁第20頁第21頁當(dāng)前第22頁第23頁第24頁第25頁第26頁第27頁第28頁第29頁第30頁第31頁第32頁第33頁第34頁第35頁第36頁第37頁第38頁第39頁第40頁第41頁第42頁第43頁第44頁第45頁第46頁第47頁第48頁第49頁第50頁第51頁第52頁第53頁第54頁第55頁第56頁第57頁第58頁第59頁第60頁第61頁第62頁第63頁第64頁
1997 Nov 17
22
Philips Semiconductors
Preliminary specification
ISO/MPEG Audio Source Decoder
SAA2502
7.4.9
D
ECODER LATENCY TIME
Latency time is defined as elapsed time between the
moment that the first byte of an audio frame is delivered to
the SAA2502 and the moment that the output response
resulting from the first (sub-band) sample of the same
frame reaches its maximum.
Latency time results from the addition of two internal
latency contributions: t
latency
= t
proc
+ t
buf
.
The processing latency time (t
proc
) is sample frequency
dependent (see Table 10).
The input buffer latency time (t
buf
) is input interface
mode dependent.
Precision of latency time calculation is sampling rate and
bit rate dependent. Maximum deviation is roughly plus or
minus 4 sample periods.
7.4.9.1
Master and slave input interface modes
Input buffer latency time t
buf
= (minimum of t
buf1
and
t
buf2
) + cr
×
3.52 ms:
t
buf1
is sample frequency dependent (see Table 10)
t
buf2
is input bit rate dependent (see Table 11 and
Table 12)
cr is the ratio between maximum and actual value of
MCLKIN frequency.
For slave input interface mode NOT the average input bit
rate should be used for table look-up, but CDCL frequency
(input bit rate during the burst). For free format bit rates the
table should be interpolated (t
buf2
is proportional to
1/bit rate).
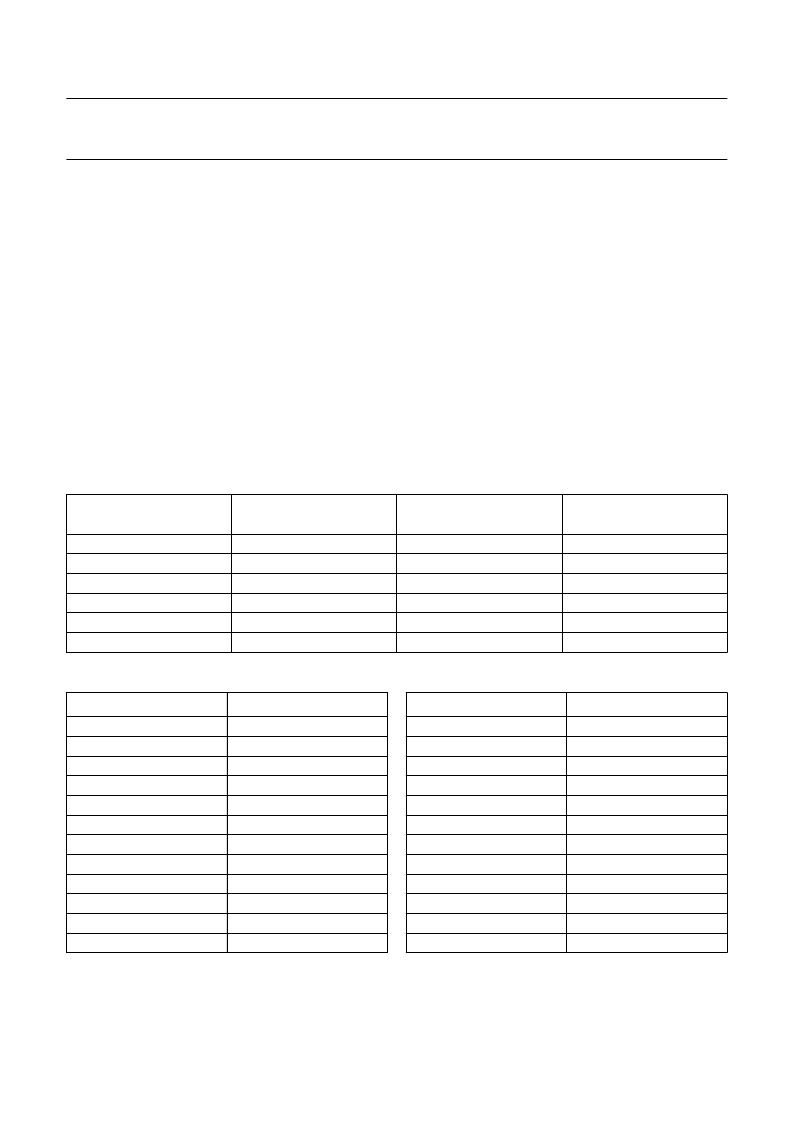
Table 10
Processing latency time
SAMPLE FREQUENCY
(kHz)
t
proc
(ms)
t
buf1
LAYER I (ms)
t
buf1
LAYER II (ms)
48
44.1
32
24
22.05
16
6.67
7.26
10.00
13.33
14.51
20.00
8.00
8.71
12.00
16.00
17.41
24.00
24.00
26.12
36.00
48.00
52.24
72.00
Table 11
Buffer latency time; high bit rate
BIT RATE (kbits/s)
t
buf2
(ms)
5.52
6.44
7.73
9.66
12.88
15.45
19.31
25.75
38.63
51.50
77.25
154.50
448
384
320
256
192
160
128
96
64
48
32
16
Table 12
Buffer latency time; low bit rate
BIT RATE (kbits/s)
t
buf2
(ms)
5.94
7.02
8.58
11.04
14.05
17.17
22.07
30.90
44.14
61.80
103.00
309.00
416
352
288
224
176
144
112
80
56
40
24
8
相關(guān)PDF資料 |
PDF描述 |
|---|---|
| SAA2502H | ISO/MPEG Audio Source Decoder |
| SAA2503 | MPEG2 audio decoder(MPEG2 音頻譯碼器) |
| SAA2503HT | MPEG2 audio decoder |
| SAA2505H-M1 | Digital multi-channel audio IC DUET |
| SAA2505 | Digital multi-channel audio IC DUET |
相關(guān)代理商/技術(shù)參數(shù) |
參數(shù)描述 |
|---|---|
| SAA2502H | 制造商:PHILIPS 制造商全稱:NXP Semiconductors 功能描述:ISO/MPEG Audio Source Decoder |
| SAA2503 | 制造商:PHILIPS 制造商全稱:NXP Semiconductors 功能描述:MPEG2 audio decoder |
| SAA2503HT | 制造商:PHILIPS 制造商全稱:NXP Semiconductors 功能描述:MPEG2 audio decoder |
| SAA2505 | 制造商:PHILIPS 制造商全稱:NXP Semiconductors 功能描述:Digital multi-channel audio IC DUET |
| SAA2505H | 制造商:PHILIPS 制造商全稱:NXP Semiconductors 功能描述:Digital multi-channel audio IC DUET |
發(fā)布緊急采購,3分鐘左右您將得到回復(fù)。