- 您現(xiàn)在的位置:買(mǎi)賣(mài)IC網(wǎng) > PDF目錄373890 > AD6620PCB (Analog Devices, Inc.) 65 MSPS Digital Receive Signal Processor PDF資料下載
參數(shù)資料
| 型號(hào): | AD6620PCB |
| 廠商: | Analog Devices, Inc. |
| 英文描述: | 65 MSPS Digital Receive Signal Processor |
| 中文描述: | 65 MSPS的數(shù)字接收信號(hào)處理器 |
| 文件頁(yè)數(shù): | 23/43頁(yè) |
| 文件大小: | 354K |
| 代理商: | AD6620PCB |
第1頁(yè)第2頁(yè)第3頁(yè)第4頁(yè)第5頁(yè)第6頁(yè)第7頁(yè)第8頁(yè)第9頁(yè)第10頁(yè)第11頁(yè)第12頁(yè)第13頁(yè)第14頁(yè)第15頁(yè)第16頁(yè)第17頁(yè)第18頁(yè)第19頁(yè)第20頁(yè)第21頁(yè)第22頁(yè)當(dāng)前第23頁(yè)第24頁(yè)第25頁(yè)第26頁(yè)第27頁(yè)第28頁(yè)第29頁(yè)第30頁(yè)第31頁(yè)第32頁(yè)第33頁(yè)第34頁(yè)第35頁(yè)第36頁(yè)第37頁(yè)第38頁(yè)第39頁(yè)第40頁(yè)第41頁(yè)第42頁(yè)第43頁(yè)
AD6620
–23–
REV. 0
Find the –100 dB column on the right of the table and look
down this column for a value greater than or equal to your
pass band percentage of the clock rate. Then look across to the
extreme left column and find the corresponding decimation
rate. Referring to the table, notice that for a decimation of 4, the
frequency having –100 dB of alias rejection is 0.071 percent
which is slightly greater than the 0.07 percent calculated. There-
fore, the maximum bound on CIC2 decimation for this condi-
tion is four. Additional decimation means less alias rejection
than the 100 dB required.
Note that although an M
CIC2
less then four would still yield the
required rejection, overall power consumption is reduced by
decimating as much as possible in this stage. Decimation in
CIC2 lowers the data rate and thus reduces power consumed in
subsequent stages.
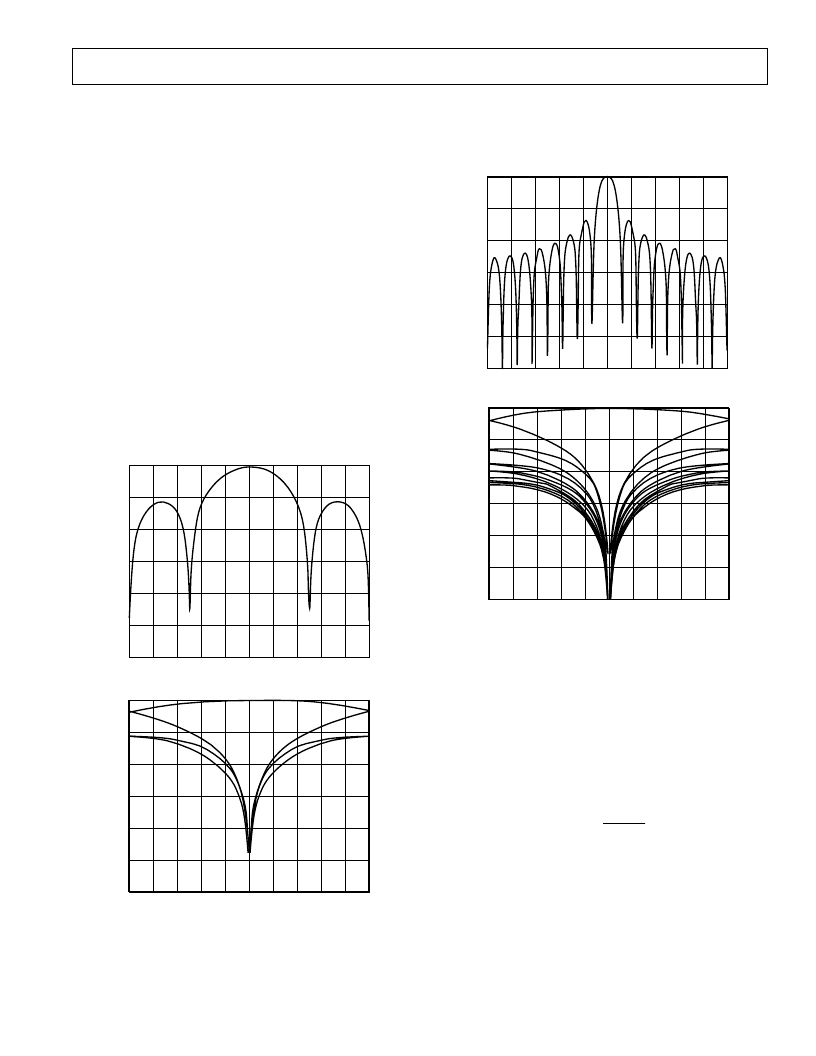
The plot below shows the CIC2 transfer function using a deci-
mation of four. The first plot is referenced to the input sample
rate, the complex spectrum from –f
SAMP
/2 to f
SAMP
/2. The sec-
ond plot is referenced to the CIC2 output rate, the complex
spectrum from –f
SAMP2
/2 to f
SAMP2
/2. The aliases of the CIC2
can be seen to be “folding back” in toward the edge of the de-
sired filter pass band. It is the level of these aliases as they move
into the desired pass band that are important.
–0.5
–120
–100
–80
–60
–40
–20
0
d
f/f
SAMP
–0.4 –0.3
–0.2
–0.1
0.1
0.2
0.3
0.4
0.5
0
–0.5
–120
–100
–80
–60
–40
–20
0
d
f/f
SAMP
2
–0.4 –0.3
–0.2
–0.1
0.1
0.2
0.3
0.4
0.5
0
Figure 41. CIC2 Alias Rejection, M
CIC2
= 4
The set of plots below show a decimation of 16 in the CIC2
filter. The lobes of the filter drop as the decimation rate in-
creases, but the amplitudes of the aliased frequencies increase
because the output rate has been reduced.
–0.5
–120
–100
–80
–60
–40
–20
0
d
f/f
SAMP
–0.4 –0.3
–0.2
–0.1
0.1
0.2
0.3
0.4
0.5
0
–0.5
–120
–100
–80
–60
–40
–20
0
d
f/f
SAMP
2
–0.4 –0.3
–0.2
–0.1
0.1
0.2
0.3
0.4
0.5
0
Figure 42. CIC2 Alias Rejection, M
CIC2
= 16
5TH ORDER CASCADED INTEGRATOR COMB FILTER
The third signal processing stage, CIC5, implements a sharper
fixed-coefficient, decimating filter than CIC2. The input rate to
this filter is f
SAMP2
. The maximum input rate is given by the
equation below. N
CH
equals two for Diversity Channel Real
input mode; otherwise N
CH
equals one. In order to satisfy this
equation, M
CIC2
can be increased, N
CH
can be reduced, or f
CLK
can be increased (reference fractional rate input timing de-
scribed in the Input Timing section).
f
f
N
SAMP
CLK
×
CH
2
2
≤
The decimation ratio, M
CIC5
, may be programmed from 1 to 32
(all integer values). When M
CIC5
= 1, this stage is bypassed and
the CIC5 scale factor is ignored.
相關(guān)PDF資料 |
PDF描述 |
|---|---|
| AD6620AS | 65 MSPS Digital Receive Signal Processor |
| AD6620S | 65 MSPS Digital Receive Signal Processor |
| AD6620 | 65 MSPS Digital Receive Signal Processor(采樣速率65MSPS的數(shù)字接收信號(hào)處理器) |
| AD6622AS | Four-Channel, 75 MSPS Digital Transmit Signal Processor TSP |
| AD6622PCB | Four-Channel, 75 MSPS Digital Transmit Signal Processor TSP |
相關(guān)代理商/技術(shù)參數(shù) |
參數(shù)描述 |
|---|---|
| AD6620S | 制造商:AD 制造商全稱(chēng):Analog Devices 功能描述:65 MSPS Digital Receive Signal Processor |
| AD6620S/PCB | 制造商:Analog Devices 功能描述:DUAL CHANNEL DECIMATING RECEIV 制造商:Analog Devices 功能描述:SGNL PROCESSOR 169CSPBGA - Bulk |
| AD6622 | 制造商:AD 制造商全稱(chēng):Analog Devices 功能描述:Four-Channel, 75 MSPS Digital Transmit Signal Processor TSP |
| AD6622AS | 制造商:Analog Devices 功能描述:Transmit Signal Processor 128-Pin MQFP 制造商:Rochester Electronics LLC 功能描述:4 CHANNEL 65 MSPS DIGITAL UPCONVERTER - Bulk |
| AD6622PCB | 制造商:AD 制造商全稱(chēng):Analog Devices 功能描述:Four-Channel, 75 MSPS Digital Transmit Signal Processor TSP |
發(fā)布緊急采購(gòu),3分鐘左右您將得到回復(fù)。