- 您現在的位置:買賣IC網 > PDF目錄377549 > IS42G32256-7PQ (INTEGRATED SILICON SOLUTION INC) POT 10K OHM 9MM VERT NO BUSHING PDF資料下載
參數資料
| 型號: | IS42G32256-7PQ |
| 廠商: | INTEGRATED SILICON SOLUTION INC |
| 元件分類: | DRAM |
| 英文描述: | POT 10K OHM 9MM VERT NO BUSHING |
| 中文描述: | 512K X 32 SYNCHRONOUS GRAPHICS RAM, 6 ns, PQFP100 |
| 封裝: | 14 X 20 MM , PLASTIC, QFP-100 |
| 文件頁數: | 31/52頁 |
| 文件大小: | 456K |
| 代理商: | IS42G32256-7PQ |
第1頁第2頁第3頁第4頁第5頁第6頁第7頁第8頁第9頁第10頁第11頁第12頁第13頁第14頁第15頁第16頁第17頁第18頁第19頁第20頁第21頁第22頁第23頁第24頁第25頁第26頁第27頁第28頁第29頁第30頁當前第31頁第32頁第33頁第34頁第35頁第36頁第37頁第38頁第39頁第40頁第41頁第42頁第43頁第44頁第45頁第46頁第47頁第48頁第49頁第50頁第51頁第52頁

IS42G32256
Integrated Silicon Solution, Inc.
ADVANCE INFORMATION
SR037-0C
09/10/98
31
ISSI
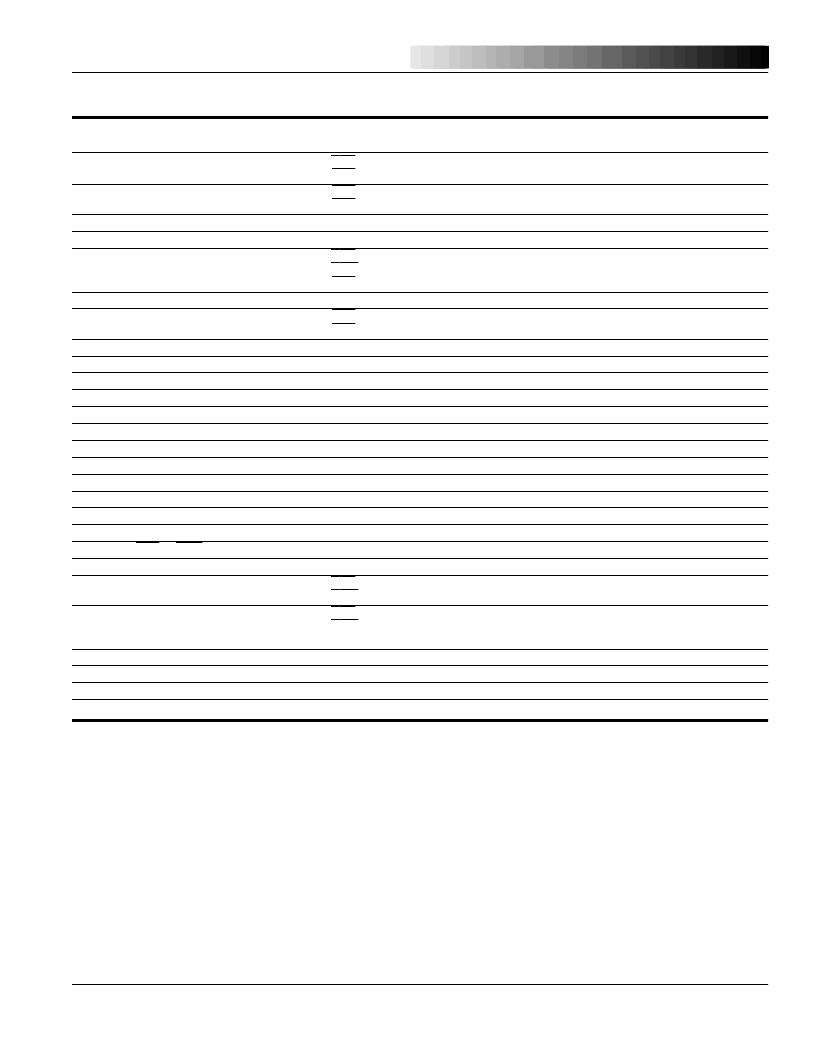
Table 20. AC Characteristics
(1,2,3)
-7
-8
-10
Symbol
t
CK
Parameter
Clock Cycle Time
Min. Max.
7
10
—
—
2.5
2.5
2.5
2.5
2.5
0
4
4
2
1
2
1
2
1
1CLK+3
2
1
63
45
21
20
14
14
14
35
35
Min. Max.
8
12
—
—
3
3
2.5
2.5
2.5
0
4
4
2.5
1
2.5
1
2.5
1
1CLK+3
2.5
1
72
48
24
20
16
16
16
40
40
Min. Max.
10
13
—
—
3.5
3.5
2.5
2.5
2.5
0
4
4
3
1
3
1
3
1
1CLK+3
3
1
90
50
26
20
20
20
20
50
50
Units
ns
CAS
Latency = 3
CAS
Latency = 2
CAS
Latency = 3
CAS
Latency = 2
—
—
6
7
—
—
—
—
—
—
6
10
—
—
—
—
—
—
—
—
—
—
—
—
6.5
8
—
—
—
—
—
—
8
12
—
—
—
—
—
—
—
—
—
—
—
—
7
9
—
—
—
—
—
—
10
14
—
—
—
—
—
—
—
—
—
—
t
AC
Access Time From CLK
(4)
ns
t
CHI
t
CL
t
OH
CLK HIGH Level Width
CLK LOW Level Width
Output Data Hold Time
ns
ns
ns
CAS
Latency = 3
CAS
Latency = 2
CAS
Latency = 1
t
LZ
t
HZ
Output LOW Impedance Time
Output HIGH Impedance Time
(5)
ns
ns
CAS
Latency = 3
CAS
Latency = 2
t
DS
t
DH
t
AS
t
AH
t
CKS
t
CKH
t
CKA
t
CS
t
CH
t
RC
t
RAS
t
RP
t
RCD
t
RRD
t
DPL
Input Data Setup Time
Input Data Hold Time
Address Setup Time
Address Hold Time
CKE Setup Time
CKE Hold Time
CKE to CLK Recovery Delay Time
Command Setup Time (
CS
,
RAS
,
CAS
,
WE
, DQM, DSF)
Command Hold Time (
CS
,
RAS
,
CAS
,
WE
, DQM, DSF)
Command Period (REF to REF / ACT to ACT)
Command Period (ACT to PRE)
Command Period (PRE to ACT)
CAS
to
RAS
Delay
Command Period (ACT [0] to ACT[1])
Last Data In To Precharge
Command Delay Time
Last Data In To Active / Refresh
Command Delay time
(Auto-Precharge, same bank)
Block Write to Precharge Command Delay Time
Block Write Cycle Time
Transition Time
Refresh Cycle Time
ns
ns
ns
ns
ns
ns
ns
ns
ns
ns
ns
ns
ns
ns
ns
100,000
—
—
—
—
—
—
—
102,000
—
—
—
—
—
—
—
102,000
—
—
—
—
—
—
—
CAS
Latency = 3
CAS
Latency = 2
CAS
Latency = 3
CAS
Latency = 2
t
DAL
ns
t
BDPL
t
BWC
t
T
t
REF
14
14
1
—
—
—
30
32
16
16
1
—
—
—
30
32
20
20
1
—
—
—
30
32
ns
ns
ns
ns
Notes:
1.
When power is first applied, memory operation should be started 100
μ
s after Vcc and VccQ reach their stipulated voltages.
Also note that the power-on sequence must be executed before starting memory operation.
Measured with t
T
= 1 ns.
The reference level is 1.4V when measuring input signal timing. Rise and fall times are measured between V
IH
(min.) and V
IL
(max.).
Access time is measured at 1.4V with the load shown in the figure below.
The time t
HZ
(max.) is defined as the time required for the output voltage to transition by
±
200 mV from V
OH
(min.) or V
OL
(max.) when the output is in the high impedance state.
2.
3.
4.
5.
相關PDF資料 |
PDF描述 |
|---|---|
| IS42G32256-8PQ | 256K x 32 x 2 (16-Mbit) SYNCHRONOUS GRAPHICS RAM |
| IS42G32256 | 256K x 32 x 2 (16-Mbit) SYNCHRONOUS GRAPHICS RAM |
| IS42S16100C1 | 512K Words x 16 Bits x 2 Banks (16-MBIT) SYNCHRONOUS DYNAMIC RAM |
| IS42S16100C1-5T | 512K Words x 16 Bits x 2 Banks (16-MBIT) SYNCHRONOUS DYNAMIC RAM |
| IS42S16100C1-5TL | 512K Words x 16 Bits x 2 Banks (16-MBIT) SYNCHRONOUS DYNAMIC RAM |
相關代理商/技術參數 |
參數描述 |
|---|---|
| IS42G32256-8PQ | 制造商:Integrated Silicon Solution Inc 功能描述: |
| IS42K | 制造商:IDEC Corporation 功能描述:SENS.IND. 10-30VDC NPN NC |
| IS42KS | 制造商:IDEC Corporation 功能描述:SENS.IND. 10-30VDC NPN NC |
| IS42L | 制造商:IDEC Corporation 功能描述:SENS.IND. 10-30VDC NPN NC |
| IS42LS16800A | 制造商:ICSI 制造商全稱:Integrated Circuit Solution Inc 功能描述:16Meg x 8, 8Meg x16 & 4Meg x 32 128-MBIT SYNCHRONOUS DRAM |
發(fā)布緊急采購,3分鐘左右您將得到回復。