- 您現(xiàn)在的位置:買賣IC網(wǎng) > PDF目錄378403 > AN-5002 (Fairchild Semiconductor Corporation) LJT 18C 18#20 SKT WALL RECP PDF資料下載
參數(shù)資料
| 型號: | AN-5002 |
| 廠商: | Fairchild Semiconductor Corporation |
| 英文描述: | LJT 18C 18#20 SKT WALL RECP |
| 中文描述: | GTLP:單與多路輸出開關(guān)技術(shù)探討 |
| 文件頁數(shù): | 2/3頁 |
| 文件大小: | 38K |
| 代理商: | AN-5002 |

www.fairchildsemi.com
2
A
How is MOS Used
When available, MOS specifications are used to determine
relative
deltas in propagation delay performance of the
device. Because MOS testing uses the AC test circuit of
Figure 1, the user must be careful in using the propagation
delay values for timing budget analysis. The actual propa-
gation delay performance will depend on the type and dis-
tribution of the load the device is driving.
The usefulness of MOS data applies more to applications
that may be synchronous in nature when more than one
output is switching simultaneously. Synchronous switching,
especially
in-phase
synchronous switching, is generally
considered the worst case application from the driving
device point of view and is consequently the setup used for
MOS testing.
Common Mistakes
There are some common mistakes when interpreting SOS
propagation delay specifications. The most common mis-
take is assuming that the specification guarantees maxi-
mum propagation delay if all outputs were simultaneously
switching. MOS derating curves explain the degradation
beyond the specified SOS propagation delay.
The other common mistake is to assume the SOS propa-
gation delay maximum specification guarantees perfor-
mance across all loading conditions. There are often
datasheet derating curves for the change in propagation
delay over capacitive load. The test load in all cases is
lumped versus distributed.
Data Specifications Format
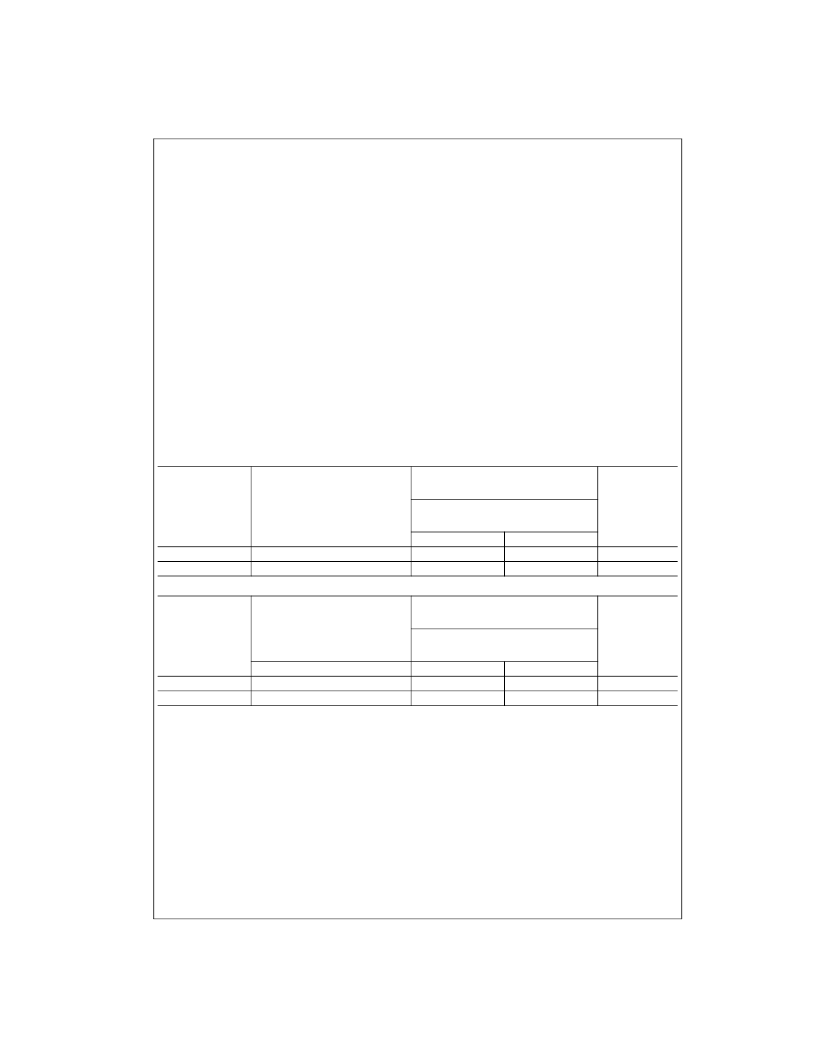
Table 1 and Table 2 are examples of datasheet specifica-
tions. Table 1 gives the maximum and minimum specifica-
tions of SOS propagation delay over the industrial/
commercial temperature range, V
CC
range, and standard
loading. Table 2 gives MOS specifications of propagation
delay with the same testing conditions as SOS but with all
outputs switching.
TABLE 1. AC Electrical Characteristics
TABLE 2. Extended AC Electrical Characteristics
T
A
=
40
°
C to
+
85
°
C,
C
L
=
30 pF, R
L
=
25
V
CC
=
3.3V
±
0.15V
V
CCQ
=
5.0V
±
0.25V
Min
1.0
1.0
Symbol
Parameter
Units
(A to B)
Max
6.5
8.2
t
PLH
t
PHL
Propagation Delay
Propagation Delay
ns
ns
Symbol
Parameter
T
A
=
40
°
C to
+
85
°
C,
C
L
=
30 pF, R
L
=
25
V
CC
=
3.3V
±
0.15V
V
CCQ
=
5.0V
±
0.25V
Min
1.0
1.0
Units
(A to B)
18 Outputs Switching
Propagation Delay
Propagation Delay
Max
8.8
9.7
t
PLH
t
PHL
ns
ns
相關(guān)PDF資料 |
PDF描述 |
|---|---|
| AN-5025 | Applications Using the GTLP10B320 |
| AN-5026 | Circular Connector; No. of Contacts:19; Series:MS27656; Body Material:Aluminum; Connecting Termination:Crimp; Connector Shell Size:15; Circular Contact Gender:Pin; Circular Shell Style:Wall Mount Receptacle; Insert Arrangement:15-19 RoHS Compliant: No |
| AN-5031 | GTLP Power Configuration |
| AN-5058 | Family Frequently Asked Questions (FAQs) |
| AN-5061 | Layout Guidelines |
相關(guān)代理商/技術(shù)參數(shù) |
參數(shù)描述 |
|---|---|
| AN500-4-3 | 制造商:SOCKET SCREWS 功能描述: |
| AN500-4-6 | 制造商:AN# - MILITARY 功能描述: |
| AN500-4-8 | 制造商: 功能描述: 制造商:undefined 功能描述: |
| AN500-6-6 | 制造商: 功能描述: 制造商:undefined 功能描述: |
| AN500-6-8 | 制造商:AN# - MILITARY 功能描述: |
發(fā)布緊急采購,3分鐘左右您將得到回復。