- 您現(xiàn)在的位置:買賣IC網(wǎng) > PDF目錄67681 > HMC714LP5E (HITTITE MICROWAVE CORP) 100 MHz - 5800 MHz RF/MICROWAVE LINEAR DETECTOR, 15 dBm INPUT POWER-MAX PDF資料下載
參數(shù)資料
| 型號: | HMC714LP5E |
| 廠商: | HITTITE MICROWAVE CORP |
| 元件分類: | 檢測器 |
| 英文描述: | 100 MHz - 5800 MHz RF/MICROWAVE LINEAR DETECTOR, 15 dBm INPUT POWER-MAX |
| 封裝: | 5 X 5 MM, ROHS COMPLIANT, PLASTIC, SMT, 32 PIN |
| 文件頁數(shù): | 23/40頁 |
| 文件大?。?/td> | 1985K |
| 代理商: | HMC714LP5E |
第1頁第2頁第3頁第4頁第5頁第6頁第7頁第8頁第9頁第10頁第11頁第12頁第13頁第14頁第15頁第16頁第17頁第18頁第19頁第20頁第21頁第22頁當(dāng)前第23頁第24頁第25頁第26頁第27頁第28頁第29頁第30頁第31頁第32頁第33頁第34頁第35頁第36頁第37頁第38頁第39頁第40頁
For price, delivery, and to place orders, please contact Hittite Microwave Corporation:
20 Alpha Road, Chelmsford, MA 01824 Phone: 978-250-3343 Fax: 978-250-3373
Order On-line at www.hittite.com
P
O
W
E
R
D
E
T
E
C
T
O
R
S
-
SM
T
12
12 - 128
Parameter
Typ.
Units
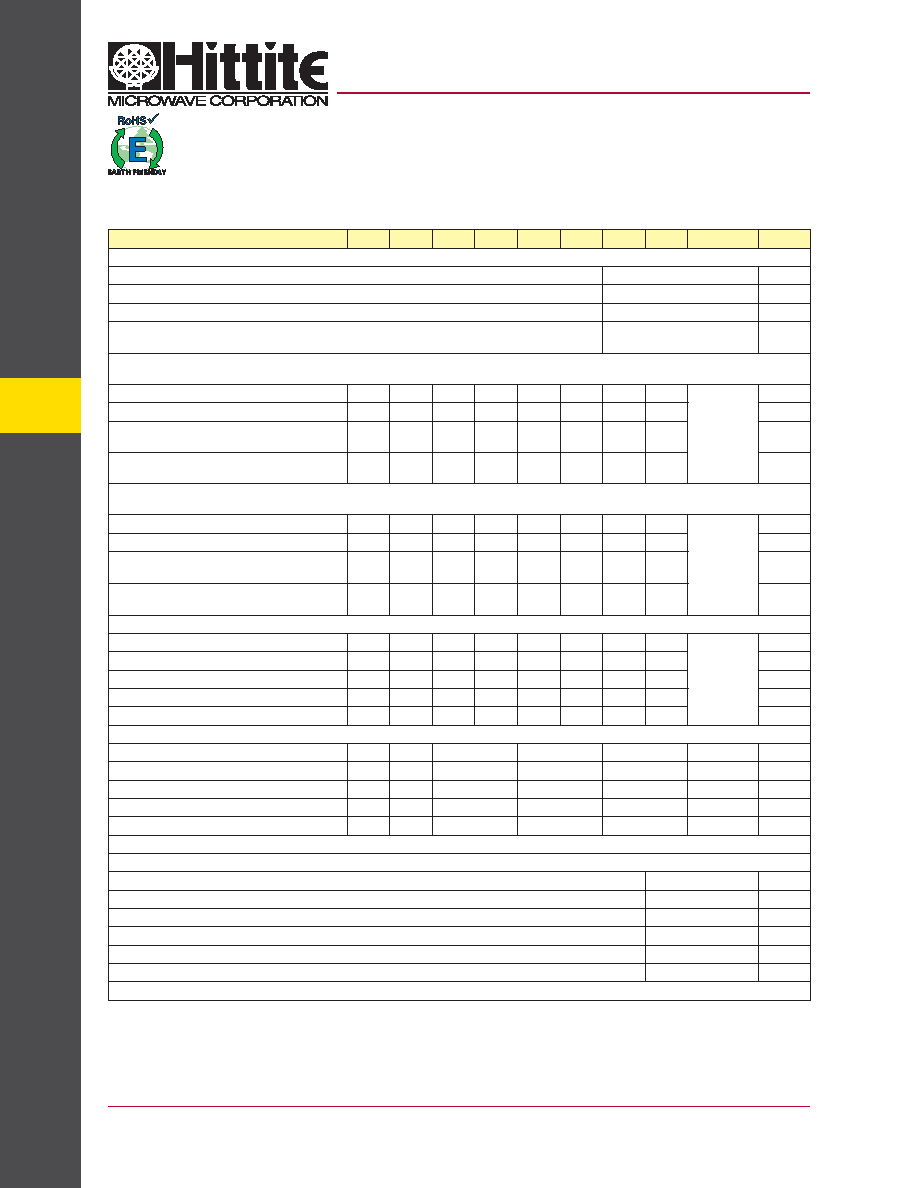
Deviation vs Temperature: (Over full temperature range -40°C to 85°C. Deviation is measured from reference, which is CW input at 25°C
Differential Input Interface with 1:1 Balun Transformer (over full input frequency range)
± 0.6
dB
Wideband Single-Ended Input Interface suitable for input signal frequencies below 1000 MHz
± 0.5
dB
Tuned Single-Ended Input Interface Suitable for input signal frequencies 1000 MHz <f <3900 MHz
± 0.6
dB
Single-Ended Input Interface with 5800 MHz tune suitable for input signal frequencies 5500 MHz
< f < 6100 MHz
± 3.9
dB
Modulation Deviation (Deviation measured from reference, which is measured with CW input at equivalent input signal power,
VTGT=2V)
Input Signal Frequency
100
500
900
1900
2200
3000
3500
3900
MHz
256QAM (2 Mbps, 8dB Crest Factor)
-0.13
-0.1
-0.3
mV/dB
WCDMA Single Carrier
(Test Model 1 with 64DPCH)
-0.3
-0.2
dBm
WCDMA 2 Carrier
(Test Model 1 with 64DPCH)
-0.5
-0.4
-0.3
-0.4
dBm
Modulation Deviation (Deviation measured from reference, which is measured with CW input at equivalent input signal power,
VTGT=1V)
Input Signal Frequency
100
500
900
1900
2200
3000
3500
3900
MHz
256QAM (2 Mbps, 8dB Crest Factor)
0.1
-0.2
-0.1
dB
WCDMA Single Carrier
(Test Model 1 with 64DPCH)
-0.1
dB
WCDMA 2 Carrier
(Test Model 1 with 64DPCH)
-0.1
dB
Differential Input Configuration Logarithmic Slope and Intercept
Input Signal Frequency
100
500
900
1900
2200
3000
3500
3900
MHz
Logarithmic Slope
37.3
37.1
37
36
36.1
36.2
38.2
mV/dB
Logarithmic Intercept
-70
-69.5
-72
-71.5
-68.5
-64
dBm
Max. Input Power at +-1dB Error
12
14
13
15
13
-5
-8
dBm
Min. Input Power at +-1dB Error
-56
-55
-56
-52
-49
dBm
Single Ended Input Configuration Logarithmic Slope and Intercept
Input Signal Frequency
100
900
1800 ± 300
2200 ± 300
3600 ± 300
5800 ± 300
MHz
Logarithmic Slope
38.2
37.9
36.6
35.4
36.8
52.5
mV/dB
Logarithmic Intercept
-67
-67.5
-67
-64.5
-44
dBm
Max. Input Power at +-1dB Error
14
6
15
12
0
dBm
Min. Input Power at +-1dB Error
-56
-54
-49
-32
dBm
iPAR Feature: INS[A,B] outputs follow Amplitude Modulated Envelope Power, scaled to Average (RMS) Signal Power
INS[A,B] and IREF[A,B] are measured with Rext = 3.9 kΩ and 50 kΩ active scope probe
IREF[A,B] Output Voltage
1.6
V
INS[A,B] Output Voltage, with CW Input Signal (EAR = 1: Reference Condition)[1]
1.6
V
INS[A,B] Scaling Factor (SF) with VTGT = 2V
190
mV
INS[A,B] Scaling Factor (SF) with VTGT = 1V
95
mV
INS[A,B] Output: Variation over Temperature (-40C to 85C)
± 2
%
INS[A,B] Output: 3 dB Video BW
35
MHz
[1] EAR: Amplitude Modulated Envelope Signal Power-to-Average (RMS) Signal Power Ratio; EAR = 1 for CW signals
HMC714LP5 / 714LP5E
v07.1109
DUAL RMS POWER DETECTOR
0.1 - 5.8 GHz
Electrical Specifications II, TA = +25°C, VCCA = VCCB = VCCBIAS = 5V, CINT = 0.1 μF
相關(guān)PDF資料 |
PDF描述 |
|---|---|
| HMC742LP5 | 70 MHz - 4000 MHz RF/MICROWAVE WIDE BAND MEDIUM POWER AMPLIFIER |
| HMC770LP4BE | 40 MHz - 1000 MHz RF/MICROWAVE WIDE BAND MEDIUM POWER AMPLIFIER |
| HMC789ST89E | 700 MHz - 2800 MHz RF/MICROWAVE WIDE BAND MEDIUM POWER AMPLIFIER |
| HMC815LC5 | 21000 MHz - 27000 MHz RF/MICROWAVE UP CONVERTER |
| HMC909LP4E | 0 MHz - 5800 MHz RF/MICROWAVE LINEAR DETECTOR, 10 dBm INPUT POWER-MAX |
相關(guān)代理商/技術(shù)參數(shù) |
參數(shù)描述 |
|---|---|
| HMC7150LP3DE | 功能描述:RF Modulator IC 16-VFQFN Exposed Pad 制造商:analog devices inc. 系列:- 包裝:剪帶 零件狀態(tài):有效 功能:- LO 頻率:- RF 頻率:- P1dB:- 本底噪聲:* 輸出功率:- 電流 - 電源:- 電壓 - 電源:6V 測試頻率:- 封裝/外殼:16-VFQFN 裸露焊盤 標(biāo)準(zhǔn)包裝:1 |
| HMC715LP3 | 制造商:HITTITE 制造商全稱:Hittite Microwave Corporation 功能描述:GaAs PHEMT MMIC LOW NOISE AMPLIFIER, 2.1 - 2.9 GHz |
| HMC715LP3E | 制造商:Hittite Microwave Corp 功能描述:IC MMIC AMP LNA PHEMT 16-QFN |
| HMC716LP3 | 制造商:HITTITE 制造商全稱:Hittite Microwave Corporation 功能描述:GaAs PHEMT MMIC LOW NOISE AMPLIFIER, 3.1 - 3.9 GHz |
| HMC716LP3E | 制造商:Hittite Microwave Corp 功能描述:IC MMIC AMP LNA PHEMT 16-QFN |
發(fā)布緊急采購,3分鐘左右您將得到回復(fù)。