- 您現(xiàn)在的位置:買賣IC網(wǎng) > PDF目錄362370 > AP603-PCB900 High Dynamic Range 7W 28V HBT Amplifier PDF資料下載
參數(shù)資料
| 型號: | AP603-PCB900 |
| 英文描述: | High Dynamic Range 7W 28V HBT Amplifier |
| 中文描述: | 高動態(tài)范圍7瓦28V的異質結雙極晶體管放大器 |
| 文件頁數(shù): | 8/14頁 |
| 文件大小: | 1182K |
| 代理商: | AP603-PCB900 |
Specifications and information are subject to change without notice
WJ Communications, Inc
Phone 1-800-WJ1-4401
FAX: 408-577-6621
e-mail: sales@wj.com
Web site: www.wj.com
Page 8 of 14 May 2007 ver 1
AP603
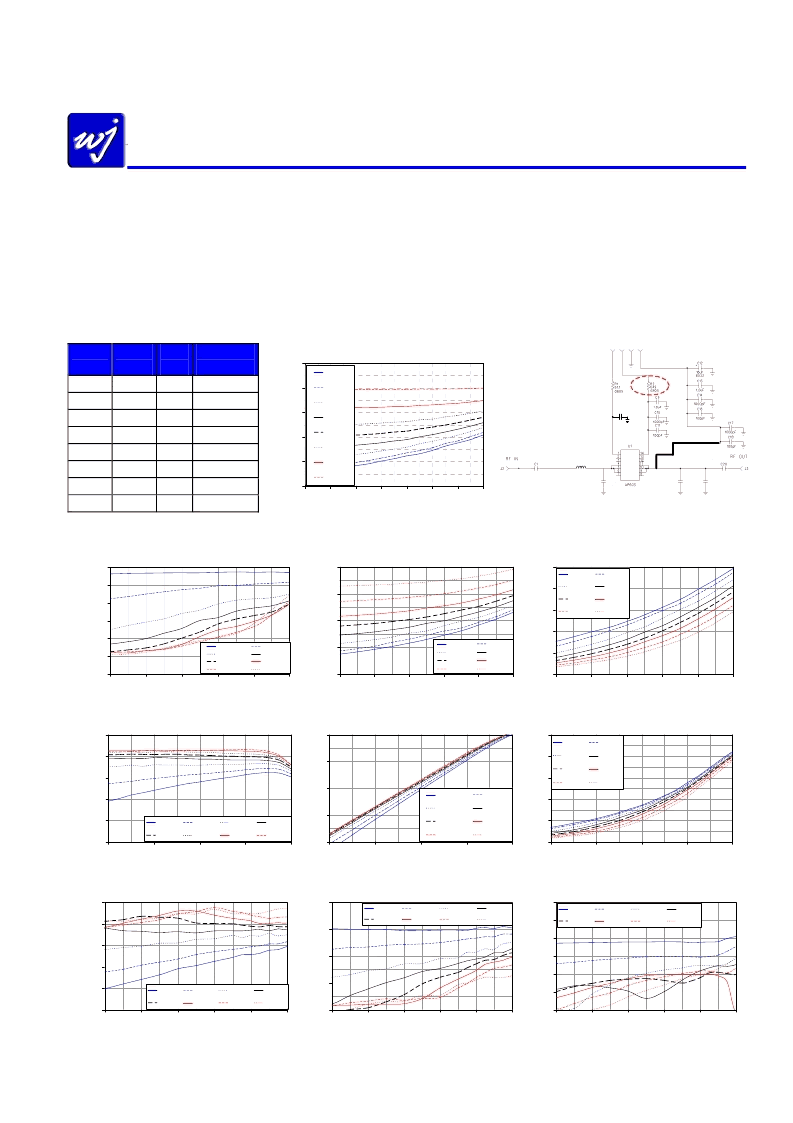
High Dynamic Range 7W 28V HBT Amplifier
1930-1990 MHz Application Note: Changing Icq Biasing Configurations
The AP603 can be configured to be operated with lower bias current by varying the bias-adjust resistor – R2. The
recommended circuit configurations shown previously in this datasheet have the device operating with a 160 mA as the
quiescent current (I
CQ
). This biasing level represents the best tradeoff in terms of linearity and efficiency. Lowering I
CQ
will
improve upon the efficiency of the device, but degraded linearity. Increasing I
CQ
has nominal improvement upon the linearity,
but will degrade the device’s efficiency. Measured data shown in the plots below represents the AP603 measured and
configured for 1.96 GHz applications. It is expected that variation of the bias current for other frequency applications will
produce similar performance results.
Icq
(mA)
(
)
(V)
(V)
20
4.32k
5
2.46
40
2.33k
5
2.52
80
1.24k
5
2.61
120
852
5
2.68
160
649
5
2.74
200
521
5
2.80
260
398
5
2.89
320
313
5
2.98
Output Power (dBm)
ACLR1 vs. Output Power vs. Icq
WCDMA, Vcc = 28V, 1960 MHz, 25
C
-35
400
C
R2
V
PD
PIN_V
PD
Thermal Rise vs. Output Power vs. Icq
Vcc = 28V
0
20
40
60
80
100
18
20
22
24
26
28
30
32
T
C
20 mA
40 mA
80 mA
120 mA
160 mA
200 mA
260 mA
320 mA
V
B
V
P
G
V
C
C28
3.3pF
C7
1000pF
100pF
L3
C5
3.3pF
C29
1.2pF
100pF
W = .030”
L = 1.035”
4.7 nH
-65
-60
-55
-50
-45
-40
22
24
26
28
30
32
Average Output Power (dBm)
A
20 mA
80 mA
260 mA
40 mA
120 mA
320 mA
Icc vs. Output Power vs. Icq
WCDMA, Vcc = 28V, 1960 MHz, 25
C
0
100
200
300
22
24
26
28
30
32
Average Output Power (dBm)
20 mA
80 mA
160 mA
260 mA
40 mA
120 mA
200 mA
320 mA
Efficiency vs. Output Power vs. Icq
WCDMA, Vcc = 28V, 1960 MHz, 25
C
0
5
10
15
20
25
22
24
26
28
30
32
Average Output Power (dBm)
C
20 mA
40 mA
80 mA
120 mA
160 mA
200 mA
260 mA
320 mA
Gain vs. Output Power vs. Icq
CW tone, Vcc = 28V, 1960 MHz, 25
C
9
10
11
12
13
14
22
26
30
34
38
Output Power (dBm)
G
20 mA
40 mA
80 mA
120 mA
160 mA
200 mA
260 mA
320 mA
Output Power vs. Input Power vs. Icq
CW tone, Vcc = 28V, 1960 MHz, 25
C
22
26
30
34
38
10
14
18
22
26
Input Power (dBm)
O
20 mA
40 mA
80 mA
120 mA
160 mA
200 mA
260 mA
320 mA
Efficiency vs. Output Power vs. Icq
CW tone, Vcc = 28V, 1960 MHz, 25
C
0
10
20
30
40
50
22
26
30
34
38
Output Power (dBm)
C
20 mA
40 mA
80 mA
120 mA
160 mA
200 mA
260 mA
320 mA
OIP3 vs. Output Power vs. Icq
CW Two-tone signal, 1960 MHz,
f = 1 MHz, Vcc = 28V, 25
C
30
35
40
45
50
55
26
28
30
32
34
36
Output Power, PEP (dBm)
O
20 mA
40 mA
80 mA
120 mA
160 mA
200 mA
260 mA
320 mA
IMD3 vs. Output Power vs. Icq
CW Two-tone signal, 1960 MHz,
f = 1 MHz, Vcc = 28V, 25
C
-60
-50
-40
-30
-20
26
28
30
32
34
36
Output Power, PEP (dBm)
I
20 mA
160 mA
40 mA
200 mA
80 mA
260 mA
120 mA
320 mA
IMD5 vs. Output Power vs. Icq
CW Two-tone signal, 1960 MHz,
f = 1 MHz, Vcc = 28V, 25
C
-80
-70
-60
-50
-40
-30
-20
26
28
30
32
34
36
Output Power, PEP (dBm)
I
20 mA
40 mA
80 mA
120 mA
160 mA
200 mA
260 mA
320 mA
相關PDF資料 |
PDF描述 |
|---|---|
| AP622 | UMTS-band 4W HBT Amplifier Module |
| AP6 | Analog IC |
| APV6 | Analog IC |
| AP77016-B08 | USAP77016-B08 AAC Audio Decoder Middleware | User's Manual[10/2002] |
| AP77016-B11 | USAP77016-B11 User's Manual | User's Manual[01/2002] |
相關代理商/技術參數(shù) |
參數(shù)描述 |
|---|---|
| AP604A-F | 功能描述:射頻放大器 AMP. 15W. 28V HBT RoHS:否 制造商:Skyworks Solutions, Inc. 類型:Low Noise Amplifier 工作頻率:2.3 GHz to 2.8 GHz P1dB:18.5 dBm 輸出截獲點:37.5 dBm 功率增益類型:32 dB 噪聲系數(shù):0.85 dB 工作電源電壓:5 V 電源電流:125 mA 測試頻率:2.6 GHz 最大工作溫度:+ 85 C 安裝風格:SMD/SMT 封裝 / 箱體:QFN-16 封裝:Reel |
| AP6050R | 制造商:未知廠家 制造商全稱:未知廠家 功能描述:PSU BENCH AUTO RANGE 1000W |
| AP607 | 制造商:Acoustic Research 功能描述:7' Black Cat6 Ethernet Cable 制造商:ACOUSTIC RESEARCH 功能描述:ACOUSTIC RESEARCH 7 CAT6 BLACK CABLE |
| AP60L02GJ | 制造商:A-POWER 制造商全稱:Advanced Power Electronics Corp. 功能描述:Low Gate Charge Simple Drive Requirement |
| AP60L02GP | 制造商:A-POWER 制造商全稱:Advanced Power Electronics Corp. 功能描述:N-CHANNEL ENHANCEMENT MODE POWER MOSFET |
發(fā)布緊急采購,3分鐘左右您將得到回復。